Grafana not displaying data
This guide is for identifying configuration mistakes in self-hosted Supabase Grafana installations
Step 1: Ping your Grafana endpoint#
Use the below cURL command to make sure your metrics endpoint returns data:
curl https://<YOUR_PROJECT_REF>.supabase.co/customer/v1/privileged/metrics --user 'user:<SECRET_API_KEY>'Step 2: Set your Grafana Dashboard to auto-refresh in the top right corner#
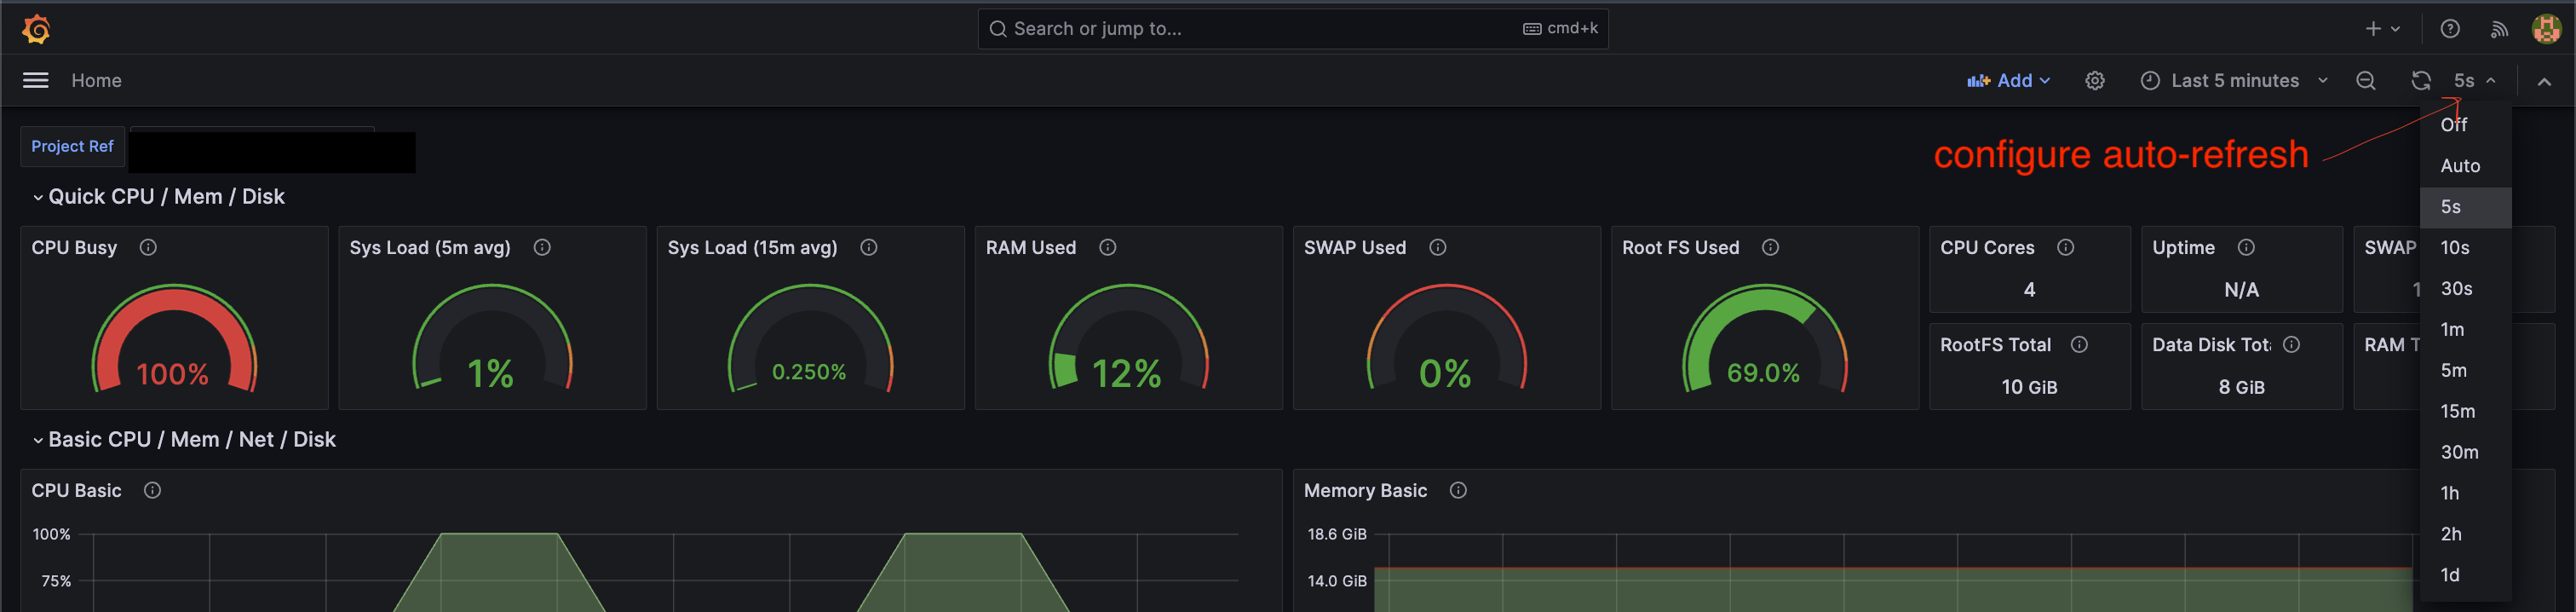
Step 3: Make sure your docker container has the default configurations#
Run the following command in the terminal:
docker ps -f name=supabase-grafanaThe output should look something like this:

Here it is in an easier to read format
- CONTAINER ID: < container id >- IMAGE: supabase-grafana-supabase-grafana- COMMAND: /entrypoint.sh- CREATED: < time >- STATUS: Up < unit of time > ago- PORTS: 3000/tcp, 0.0.0.0:8000 → 8080/tcp- NAMES: supabase-grafana-supabase-grafana-1Step 4: Enter the container#
Try running the following terminal command:
docker exec -it <container id> bashStep 5: Check the environment variables for errors#
Run the following in the docker container:
printenv | egrep 'GRAFANA_PASSWORD|SUPABASE_PROJECT_REF|SUPABASE_SECRET_KEY'Ensure the values are correct by comparing them with those in the Dashboard. Users have previously encountered issues by accidentally omitting the last character of their strings, so a thorough check is essential.
Step 6: Go to the root folder and check permissions on the entrypoint.sh file#
Run the following terminal commands:
cd /ls -l | grep entrypoint.shentrypoint.sh should have the following permissions:
-rwxr-xr-xIf off, update the values
chmod +x entrypoint.sh