Metrics API
Every Supabase project exposes a Prometheus-compatible Metrics API endpoint that surfaces ~200 Postgres performance and health series. You can scrape it into any observability stack to power custom dashboards, alerting rules, or long-term retention that goes beyond what Supabase Studio provides out of the box.
Chart a subset of the same window in Studio Reports. Use this page when you want the Prometheus-compatible scrape endpoint.
The Metrics API is currently in beta. Metric names and labels might evolve as we expand the dataset, and the feature is not available in self-hosted Supabase instances.
What you can do with the Metrics API#
- Stream database CPU, IO, WAL, connection, and query stats into Prometheus-compatible systems.
- Combine Supabase metrics with application signals in Grafana, Datadog, or any other observability vendor.
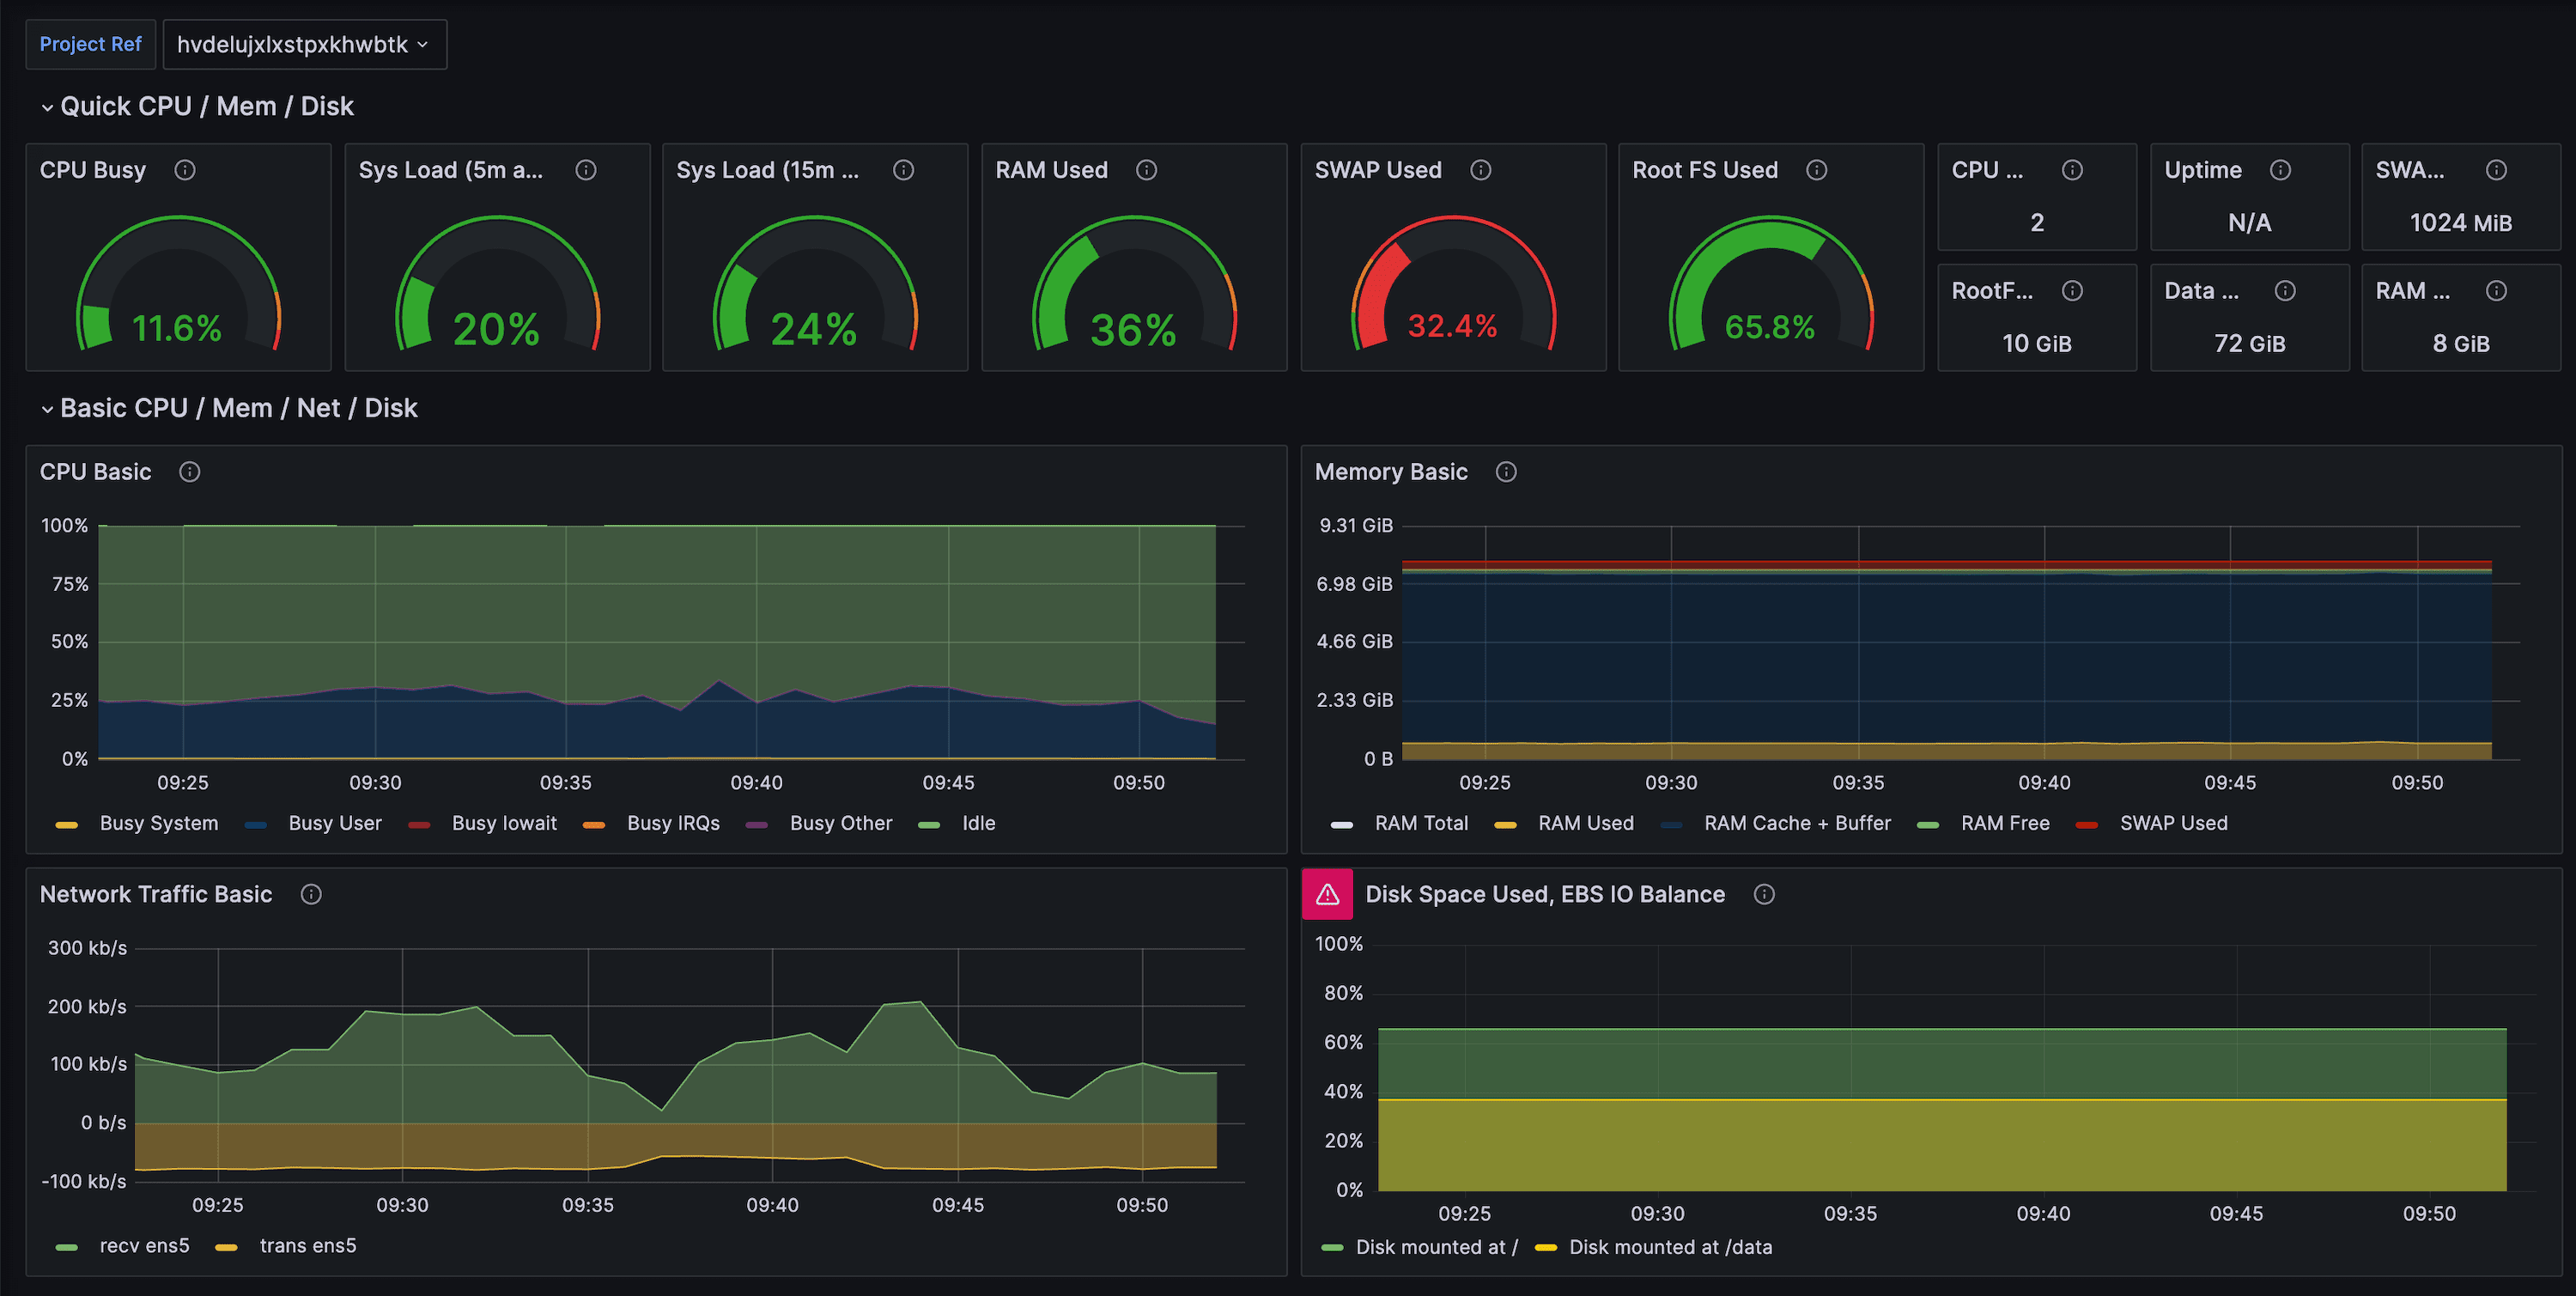
- Reuse our supabase-grafana dashboard JSON to bootstrap over 200 ready-made charts.
- Build your own alerting policies (right-sizing, saturation detection, index regression, and more).
Choose your monitoring stack#
Pick the workflow that best matches your tooling. Cards link to Supabase-authored guides or vendor integration docs, and some include a “Community” pill when there’s an accompanying vendor reference.
Grafana Cloud (SaaS)
Grafana + self-hosted Prometheus
Datadog
Elastic
Vendor-agnostic / BYO Prometheus
Additional resources#
- Supabase Grafana repository for dashboard JSON and alert examples.
- Grafana Cloud’s Supabase integration doc (community-maintained, built on this Metrics API).
- Datadog’s Supabase integration doc (community-maintained, built on this Metrics API).
- Elastic’s Supabase integration doc (community-maintained).
- Log Drains for exporting event-based telemetry alongside metrics.
- Query Performance report for built-in visualizations based on the same underlying metrics.