Monitor pipeline status
Track replication status, view logs, and troubleshoot issues.
Public Alpha
Supabase Pipelines is currently in public alpha. Features and behavior may change as we continue developing the product.
Use the Dashboard to check replication progress, investigate lag, and recover from errors.
Viewing pipeline status#
Open Database > Pipelines to see each destination's pipeline status.
Pipeline states#
| State | Meaning |
|---|---|
| Stopped | Not running; requires a manual start |
| Starting | Starting or replacing the process after a restart |
| Running | Process is running |
| Stopping | Finishing in-flight work before stopping |
| Restarting | Applying settings or table state before restarting |
| Failed | Reports a startup or runtime failure; can recover automatically |
| Unknown | Status is unavailable |
Running does not confirm that initial sync has finished, the source is connected, or destination writes are complete. Check table states and lag to assess progress.
Viewing detailed pipeline metrics#
Click a pipeline in the list to inspect its metrics and table states.
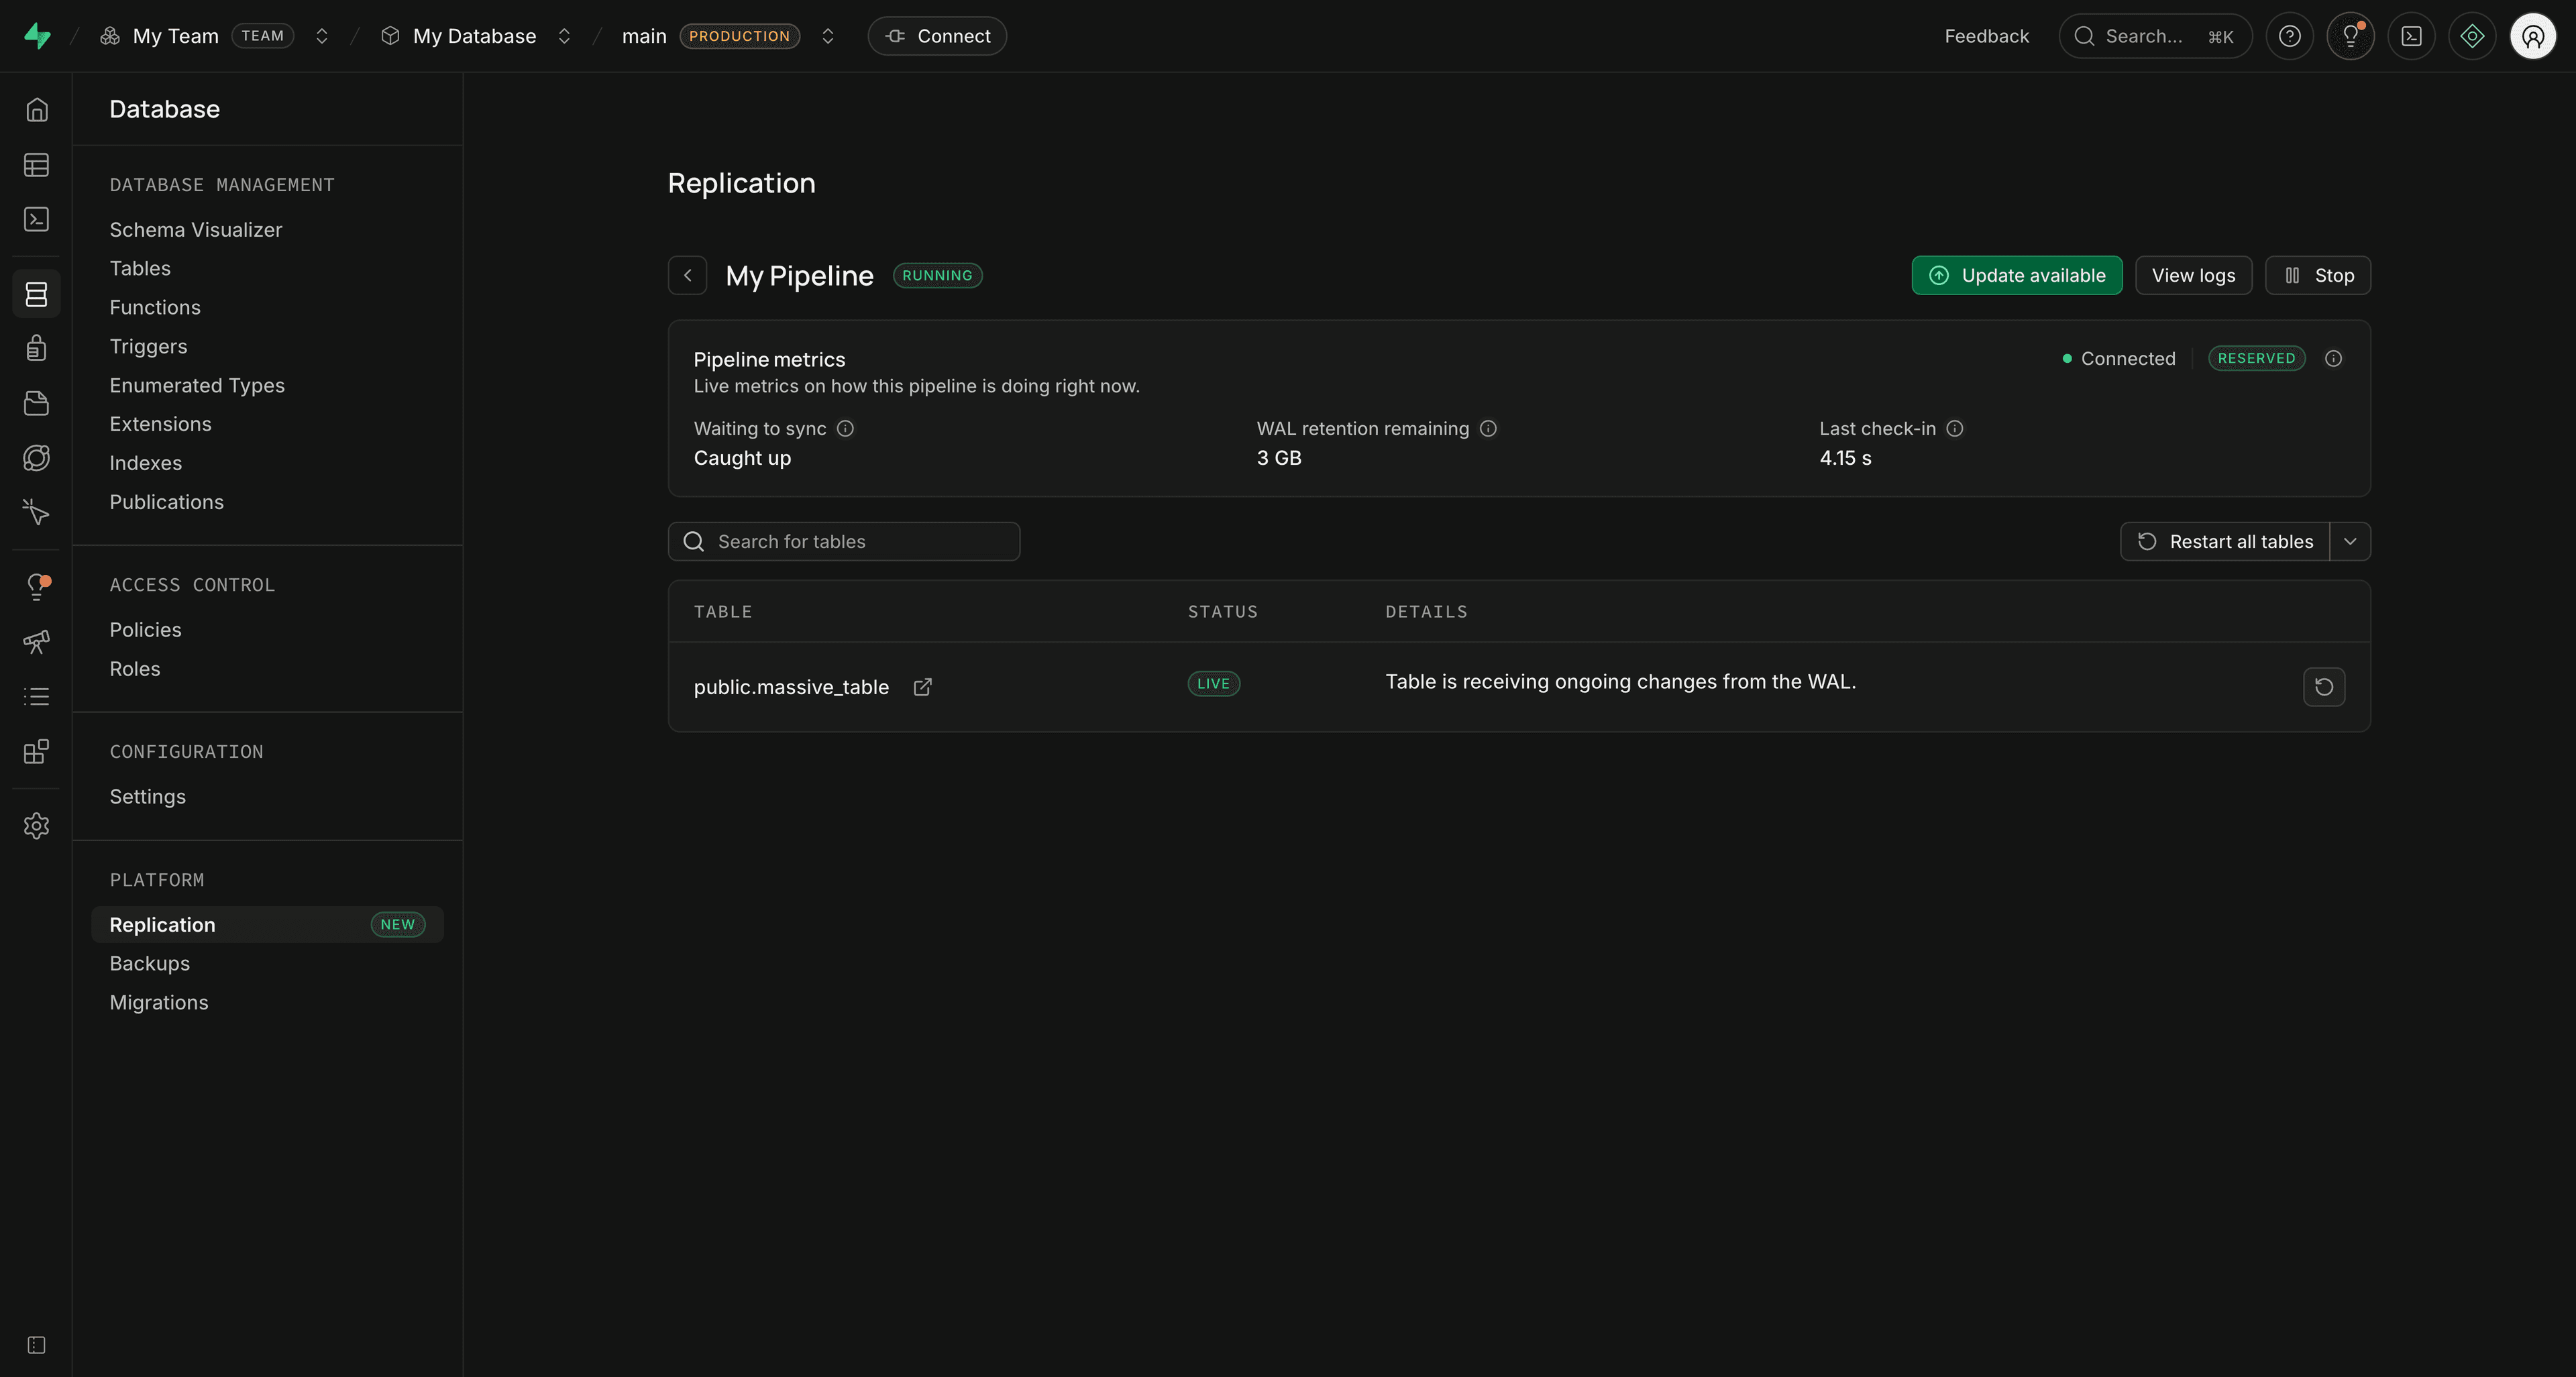
Table states#
| State | Meaning |
|---|---|
| Queued | Waiting to begin initial sync |
| Copying | Copying existing rows |
| Copied | Copy finished; changes made during the copy still need to be applied |
| Live | Following WAL changes, including catch-up after copying |
| Error | Replication encountered an error |
| Restarting | Restarting replication for the table from scratch |
| Not Available | State is temporarily unavailable during a pipeline state change |
| Unknown | The Dashboard does not recognize the reported state |
Replication lag metrics#
These metrics come from Postgres replication slot state. The pipeline list also shows a byte-based lag value: Caught up means no gap between the confirmed flush position and current WAL position at measurement time. It does not guarantee that every table has finished initial sync or that data is visible to destination queries.
| Metric | Meaning | Investigate when |
|---|---|---|
| Waiting to sync | WAL bytes between the confirmed flush position and current Postgres WAL position | The value keeps growing |
| WAL retention remaining | WAL that can accumulate before the slot risks becoming unusable, based on max_slot_wal_keep_size | The value is small or shrinking |
| Last check-in | Time since the last replication feedback to Postgres | Feedback is old or missing |
| Connected | Whether the replication slot is active | It says Not connected while the pipeline should be running |
| Slot status | Whether required WAL is still retained | The slot is Unreserved or Lost |
The Dashboard displays Unlimited when Postgres returns no safe_wal_size. That happens both with unlimited retention and with a Lost slot, so always check slot status. See Postgres replication slot metrics.
Pipelines keeps sending feedback during slow writes and while WAL reading is paused. It repeats the last safe position without acknowledging unfinished writes. A recent check-in and an active connection can therefore coexist with growing lag.
The main slot tracks ongoing replication. Table-sync slots appear temporarily during initial sync and have the same metrics.
Slot statuses#
| Status | Meaning |
|---|---|
| Reserved | Required WAL is retained within the normal WAL size limit |
| Extended | Required WAL is retained beyond that limit; this alone does not mean lag is growing |
| Unreserved | Required WAL is no longer fully reserved and can be removed |
| Lost | Required WAL has been removed; replication cannot continue from this slot |
| Unknown | Slot state is unavailable or unrecognized |
See Respond based on the slot status for recovery actions.
Viewing logs#
Open Logs > Replication for errors, retries, and performance warnings. Include the pipeline ID and relevant errors when contacting support.
Handling errors#
Table errors can pause one table while others continue replicating. Pipeline errors affect the overall process.
Table errors#
Open the pipeline, inspect the table error and any scheduled retry, and fix the cause. If replication cannot safely resume from its saved state, restart replication for the affected tables.
Pipeline errors#
A Failed pipeline can recover automatically. Check logs for persistent connectivity, permission, schema, or destination errors, fix the cause, and restart if needed. Supabase stops pipelines after repeated failures; a Stopped pipeline requires a manual start.
Dealing with replication lag#
Lag grows when Postgres produces WAL faster than Pipelines confirms progress. Some lag is expected during initial sync, write bursts, and recovery from downtime. Sustained growth or shrinking WAL retention requires investigation.
Investigate the lag#
- Open the pipeline and compare Waiting to sync with WAL retention remaining and Slot status.
- Check Connected and Last check-in for connection or feedback problems.
- Check table states for initial sync or table errors.
- Open replication logs and look for destination errors, rate limits, retries, or repeated restarts.
- Compare the lag trend with source activity, such as bulk imports, large transactions, or long-running writes.
Common causes include a slow destination, source or pipeline resource limits, network latency, and stopped or disconnected pipelines.
Initial sync and table-sync slots#
Pipelines uses one main slot plus up to one temporary slot per active table-sync worker. These slots retain changes made while rows are copied. After copying and catch-up finish, the temporary slot is removed and the table continues through the main slot.
If a table-sync slot is lost, that table must repeat its initial sync. Automatic retries can recover individual tables; a manual table restart temporarily stops the whole pipeline.
To improve copy throughput:
- Increase Initial sync connections per table when one large table is the bottleneck.
- Increase Table sync workers when several tables need to copy concurrently.
- Reduce bulk writes until the table is Live and its lag has caught up.
Higher concurrency uses more source connections, and additional workers need more slots. Increase it only while the source database, network, and destination have capacity. See setting defaults and limits.
Respond based on the slot status#
| Slot status | Action |
|---|---|
| Reserved or Extended | Monitor the trend. If lag keeps growing, investigate destination performance, source write volume, and logs. |
| Unreserved | Restore connectivity or resolve throughput and write failures before Postgres removes required WAL. Contact support if lag continues to grow. |
| Lost | For a table-sync slot, retry the affected table. For the main slot, use the recovery procedure that follows. |
| Unknown | Check logs and slot details. If the state persists, contact support with the pipeline ID and error details. |
To recover a lost main slot, open Edit pipeline > Advanced settings and set Invalidated slot behavior to Recreate slot. Review the effects below, then click Apply and restart pipeline or Apply and start pipeline, depending on its current state.
This replaces every destination table. Existing source rows are copied only for tables selected for initial sync; excluded tables resume with new changes only. Data processed again is billed again.
Alternatively, stop and delete the pipeline, then create a new one. Deletion automatically removes that pipeline's main slot, table-sync slots, and saved replication state when the source database is reachable. It leaves source tables, existing destination data, and the shared Pipelines installation in place.
Reduce future lag risk#
- Review the WAL retention recommendation at creation and continue monitoring retention after startup.
- Publish only the tables and operations you need.
- Avoid prolonged stops while the source is receiving writes.
- Schedule bulk writes and initial sync during quieter periods when possible.
Restarting tables#
Restart table replication to rebuild one or more destination tables from scratch, for example after a schema change or an unrecoverable table error. Restart pipeline restarts the process using saved replication progress; it does not request a table rebuild. See pipeline restart and recovery behavior for exceptions during initial sync or lost-slot recovery.
When you restart table replication:
- All existing data in the affected destination tables is deleted. The original Postgres source tables and their rows are unchanged.
- For tables selected for initial sync, Pipelines copies all current source rows included by the publication again, then resumes ongoing replication. Tables excluded from initial sync resume with new changes only; their existing source rows are not copied.
- The table restart resets replication progress only for the selected tables.
- Data processed again is billed again.
The pipeline stops temporarily to apply the table restart. The Dashboard restarts it automatically, or starts it if it was stopped. Replication for other tables is paused during this process, and their unfinished initial syncs can restart from scratch.
Before restarting, use Edit pipeline to check the Initial sync selection. Include any affected tables whose existing source rows you need to copy again, then apply your changes. Open the pipeline from the list on Database > Pipelines.
Restart a single table#
- Click the restart icon on the table's row.
- Review the table name, data replacement, and cost details in the confirmation dialog.
- Click Restart replication.
Restart multiple tables#
- Click Restart all tables, or open the arrow menu beside it and select Restart failed tables only.
- Review the affected tables, data replacement, and cost details. The failed-tables action affects every table that is failed when the request runs.
- Confirm Restart all tables or Restart failed tables, matching the scope you chose.
If a table restart fails, refresh the pipeline and table states before retrying. Start the pipeline explicitly if it remains Stopped.